You're Measuring Everything Except What Matters
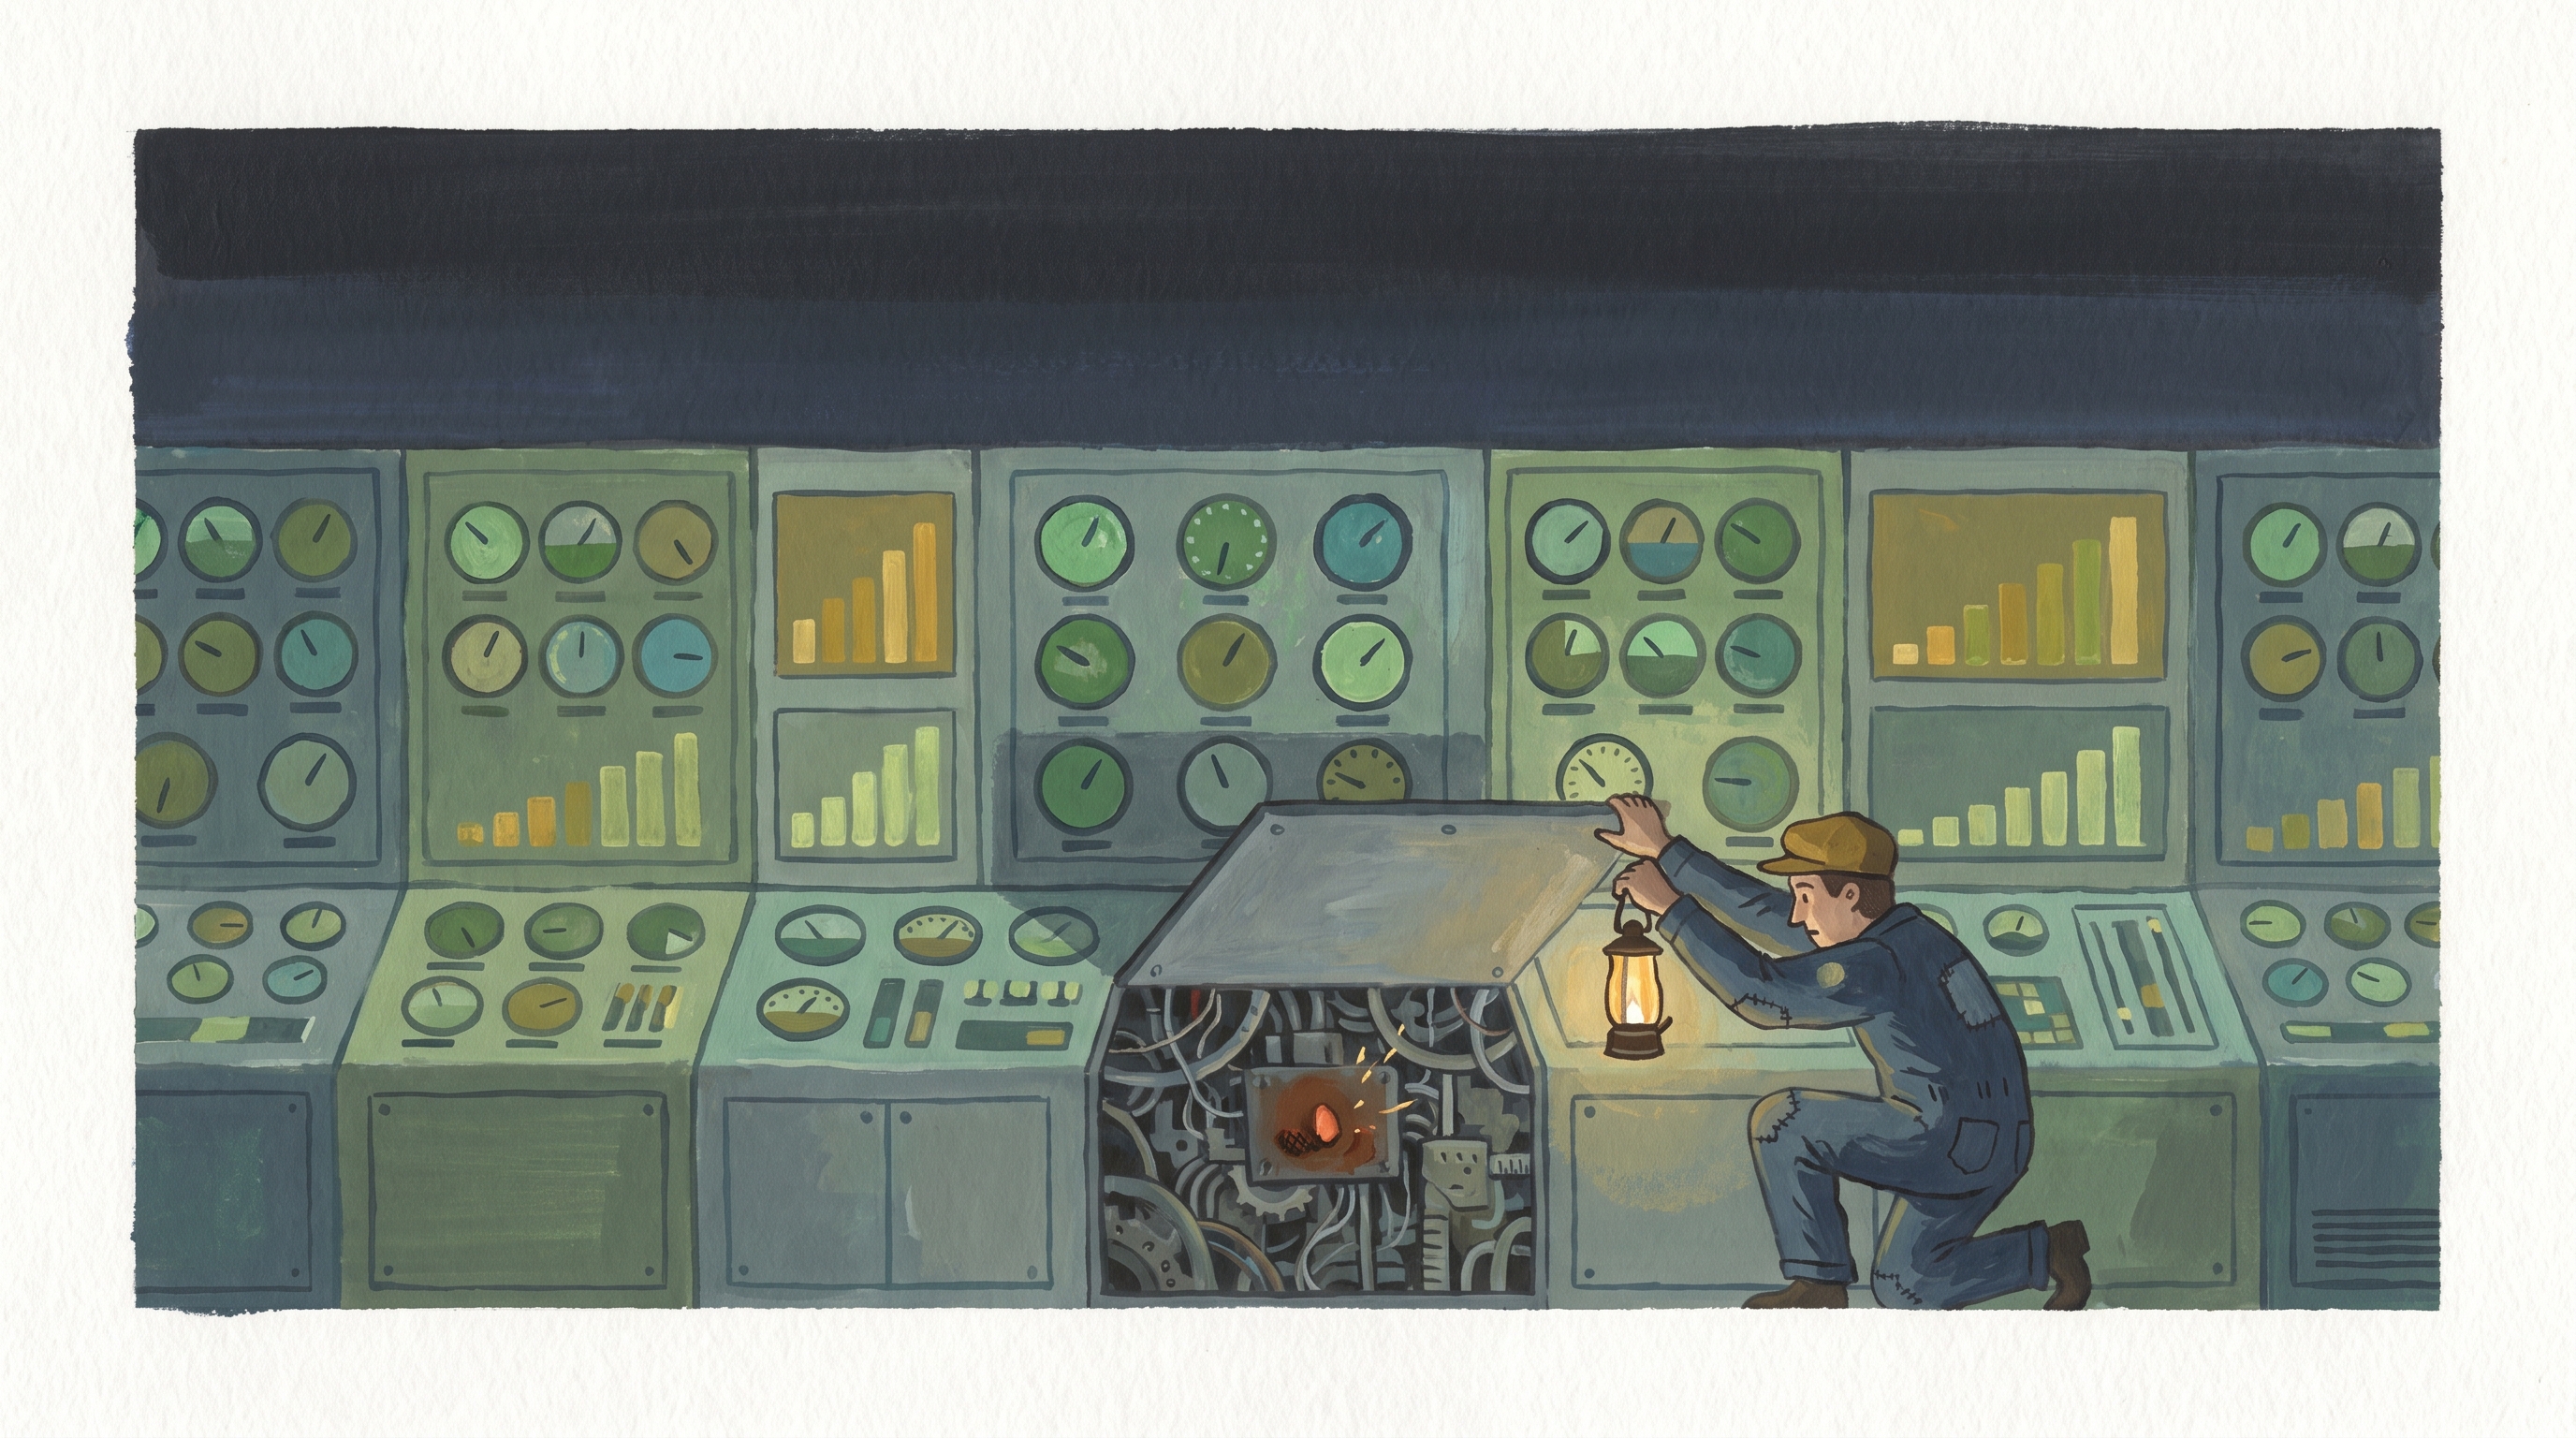
There is a particular kind of organisational confidence that comes from a well-populated dashboard. Numbers in green. Graphs trending in the right direction. A p99 latency that looks acceptable, an error rate that hasn't budged in weeks. The system is healthy. You know this because the dashboard says so.
Then something breaks — not catastrophically, just subtly, in the particular way that distributed systems choose to fail when they want to be pedagogical about it. And the person who fixes it fastest isn't the one who built the best dashboard. It's the engineer who's been running the system for three years, who has an intuition about why the queue depth always climbs on Tuesday mornings, who says "this smells like the billing service doing its weekly reconciliation job again" before they've opened a single graph. They have a mental model. The dashboard does not.
This is not an argument against metrics. It is an argument about what metrics can and cannot do, and about a failure mode that afflicts teams who confuse measurement with comprehension.
The proliferation problem
The cost of instrumentation has fallen dramatically. Adding a new metric is cheap. Adding fifty new metrics is also cheap. The consequence is that most mature systems are measured at every joint and seam, emitting telemetry into pipelines that fan out into Prometheus, Datadog, Grafana, whatever the previous SRE chose before they left for a better-paying job. The volume of signal is not the problem. The density of signal per unit of comprehension is.
Charles Goodhart, in a 1975 paper on monetary policy, observed something that has since been generalised far beyond its original context: any observed statistical regularity will tend to collapse once pressure is placed upon it for control purposes. The colloquial version — "when a measure becomes a target, it ceases to be a good measure" — has become one of those aphorisms that people quote in retrospectives while continuing to do the thing it warns against. Goodhart's Law doesn't just describe gaming. It describes a more fundamental structural problem: metrics are proxies, and proxies have limits.
The further issue is selection pressure. You can only monitor what you already know to ask about. Teams instrument the things they expect to fail, the things that failed last time, the things that show up in post-mortem action items. This produces a monitoring suite that is, in effect, a catalogue of past incidents. It is a forensic record of the failures you've already had. What it cannot do is describe the failure modes you haven't imagined yet — what Charity Majors has described, with characteristic directness, as the shift from known-unknowns to unknown-unknowns.
The dashboard tells you how the system compares to your previous mental model of the system. It cannot tell you whether that mental model is still accurate.
When the map stops matching the territory
McNamara's mistake — and it is useful to name it precisely, since it has a name — was not using metrics. It was applying the discipline of quantitative measurement to a system whose critical properties were not quantifiable, and then treating the absence of a number as evidence of unimportance. The four steps of what Daniel Yankelovich called the McNamara Fallacy are: measure what can be measured; disregard what can't be measured; presume that what can't be measured isn't important; conclude that what can't be measured doesn't exist. Step four, Yankelovich observed, is suicide.
In production systems, the unmeasured things are often the load-bearing ones. The implicit coupling between two services that nobody documented because it was "just" an internal implementation detail. The query pattern that only emerges at a particular cardinality of customer data. The backpressure behaviour of a message broker under a specific failure sequence that the test environment never exercises. These don't show up on a dashboard until after they've already caused an incident, at which point they show up very clearly.
The real casualty of metrics proliferation isn't signal quality, though that suffers too. It's causal reasoning. An engineer with a mental model of the system can look at an anomaly and form a hypothesis: "this is probably downstream of X, which usually happens when Y". An engineer working from dashboards alone pattern-matches against past incidents. The first approach generates hypotheses that can be tested and refined. The second is essentially a lookup table that degrades with novelty.
Charity Majors captured this precisely: in the observability 1.0 model, where you flip between dashboards pattern-matching with your eyeballs, the best debuggers are always the engineers who have been there the longest and seen the most. Your monitoring has become a knowledge externalisation problem, and the knowledge it fails to externalise is the expensive kind.
Dashboards versus debugging
A dashboard is a passive thing. It shows you a state. It does not ask questions.
Debugging is an active process. You form a hypothesis, you interrogate the data, you follow the trail of causality backwards to the event that produced the current state. The difference matters enormously when the failure is novel, because a novel failure won't show up as an anomaly in your existing dashboards — or if it does, the anomaly will appear in a graph you haven't checked, correlated with a dimension you didn't know was relevant.
The standard SRE response to this is more dashboards. Build a runbook. Standardise the on-call playbook. This is sensible operational hygiene, but it is also, at the margin, a codification of known failure modes. It works until something new happens, and in complex distributed systems, something new happens with an awkward regularity.
Distributed tracing exists precisely because the request-scoped view of a system's behaviour is often the only view that makes causality legible. A trace tells a story: this request took this path, waited here, failed here, cascaded here. It is a narrative. A metric aggregated over a time window is a statistical summary. Both are useful; they answer different questions; and the questions answered by traces are, in many incident scenarios, the questions you actually need answered.
The observability tooling space has understood this for years. OpenTelemetry has standardised the instrumentation layer. The tooling around wide structured events and high-cardinality query engines is genuinely mature. None of which prevents teams from using their new observability platform primarily to build more dashboards.
Measurement as a substitute for understanding
There is a slightly uncomfortable thing to say here, which is that excessive dashboard-building is often a response to a confidence problem rather than an information problem. Teams that don't deeply understand their systems build dashboards to provide the appearance of understanding. The dashboard says things are fine, so things are probably fine. This is not always wrong, but it is not understanding. It is reassurance.
The signal-to-noise problem compounds this. A sufficiently rich telemetry pipeline will contain, somewhere, the signal for almost any failure. The difficulty is finding it. When your monitoring stack has three hundred dashboards, you do not have three hundred sources of understanding — you have three hundred places to look during an incident, and an incident is exactly when you have no time to look. The mental model that an experienced engineer carries around is, among other things, a compression of this search space. It's the reason the three-year engineer fixes things faster than the new hire with better tooling.
The irony is that more measurement, pursued without corresponding investment in comprehension, tends to erode the very mental models it should be supporting. If dashboards are the primary interface with production, then production becomes the thing the dashboards show. Engineers stop reasoning about system behaviour and start reasoning about graph shapes. These are not the same thing, and conflating them produces an on-call rotation that can react to known failures but cannot reason about new ones.
Combining signals with narrative
The case for traces is partly technical — they show causality in a way that metrics cannot — and partly epistemic. A trace encourages you to think about what a request is actually doing, which is a system-comprehension exercise in a way that setting up a metric aggregation is not. Instrumenting a code path forces you to think about what's happening in that code path. It is documentation that decays at the same rate as the code, because it is part of the code.
The narrative piece matters as well. Incident post-mortems that are just timeline reconstructions from metrics data tend to describe what happened without capturing why. A post-mortem that traces the causal chain — this service started returning 503s, which caused this queue to back up, which caused this retry storm, which caused this database connection pool to exhaust — is a tool for building shared mental models across a team. The metric says the error rate spiked. The trace says why.
Good observability practice is not metrics versus traces versus logs. It is asking what kind of question you're trying to answer. Metrics answer "how much?" and "is this normal?". Logs answer "what happened, verbatim?". Traces answer "why did this happen, and in what order?". Using only the first of these and calling it observability is like using only heart rate data to assess whether someone is healthy. It will catch some things. It will miss others. And it will create a great deal of false confidence.
Building shared mental models
The problem with mental models is that they live in heads, which are not shared infrastructure. The engineer who understands the system deeply is a single point of failure — arguably a worse one than a poorly-designed service, because they're harder to replicate and they eventually leave.
This is the argument for treating observability as a practice rather than a tooling choice. The goal is not to have good dashboards. The goal is for the team to be able to form correct hypotheses about system behaviour, quickly, even in novel failure conditions. That requires a combination of: tooling that makes causal reasoning tractable (traces, structured events, high-cardinality query capability), processes that surface system knowledge explicitly (blameless post-mortems that capture causal chains, not just timelines; runbooks that explain the 'why'), and a culture where engineers are expected to understand the systems they operate, not just respond to the alerts those systems generate.
The last point is harder to instrument, which is possibly why it's often underinvested. You cannot put "depth of engineer's causal understanding of the billing service" on a dashboard. You cannot set an alert for "team's mental model is drifting from system reality". But the effects of both are visible, eventually — in mean time to resolution, in the quality of post-mortems, in whether incidents recur or are genuinely resolved.
Goodhart's Law is at work here too. If you measure the team on dashboard coverage and alert quality, you will get very good dashboards and very tuned alerts. You will not necessarily get a team that understands the system. The thing you actually want — rapid, accurate reasoning about novel failures — is hard to measure directly. That doesn't mean it doesn't exist.
The point
Metrics are a map. A map is useful, is often indispensable, but is not the territory. The territory is the actual runtime behaviour of the system, the causal relationships between its components, the history of its failure modes and how they were resolved, the implicit knowledge that accumulates in the heads of people who've been operating it long enough to have intuitions.
You can measure your systems extensively and understand them poorly. You can have green dashboards and have no idea what is actually holding the thing together. Both of these conditions are common, and neither of them is safe.
The alternative is not fewer metrics. It is using metrics as one input to a practice of active comprehension — of forming models, testing them, updating them, and making the process legible to the whole team rather than locking it in the heads of whoever has been on-call the longest. That is what the better observability tooling is actually for. Whether teams use it that way is a different question.
References
- Goodhart, C. (1975). Problems of Monetary Management: The U.K. Experience. Original formulation.
- Yankelovich, D. (1971). Interpreting the New Life Styles, Sales Management. Source of the McNamara Fallacy four-step formulation.
- Majors, C., Fong-Jones, L., Miranda, G. (2022). Observability Engineering: Achieving Production Excellence. O'Reilly Media. The canonical book-length treatment.
- Majors, C. (2023). Observability 2.0. charity.wtf. The argument for unified storage over siloed pillars, and for tooling built around unknown-unknowns.
- Muller, J.Z. (2018). The Tyranny of Metrics. Princeton University Press. The broader argument about metric fixation in organisations.
- Wikipedia: Goodhart's Law — for the Hoskin (1996) and Strathern (1997) formulations that generalised the original.
- Wikipedia: McNamara Fallacy — Yankelovich's four-step formulation; Vietnam War context.
- Majors, C. (2017). Observability and Understanding the Operational Ramifications of a System (InfoQ interview) — includes her framing of known-unknowns vs unknown-unknowns.
- OpenTelemetry Documentation: Observability Primer — good explainer on the signals model (traces, metrics, logs) and why each answers a different class of question.